Quantitative Analysis Tools for Cultural Heritage Organisations
Summary
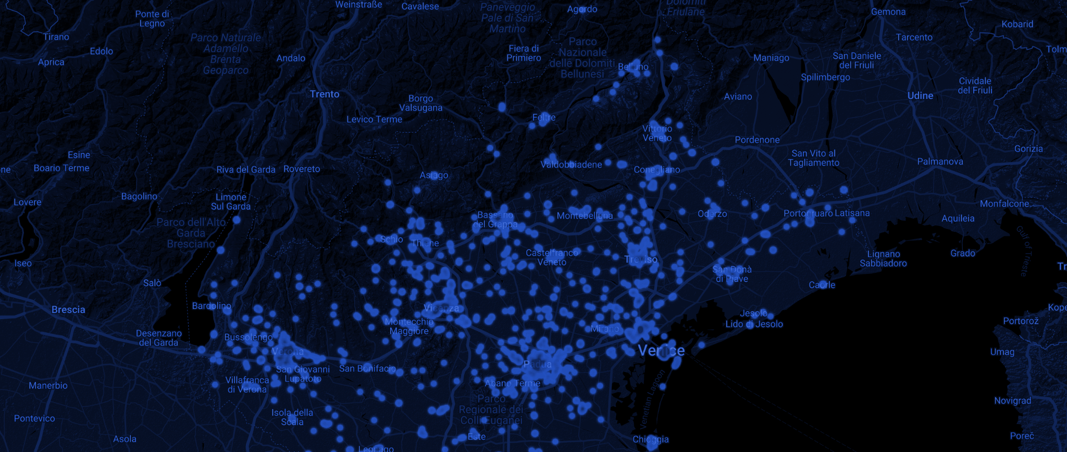
Heritage mapping projects can provide useful insights for researchers, cultural organisations and policymakers and often rely on quantitative data collection, analysis and visualisation techniques. This guide provides some basic guidance on how to collect data and structure a database to then use data visualisation tools for exploratory and explanatory analysis.
Key Take-aways
Development of cultural observation and mapping practices
Collecting and organising data systematically into a database
Exploratory and explanatory data analysis and visualisation
Main types of graphs and charts and when to use them
Static vs dynamic data dashboards and data stories
Author/Speaker
Andrea Santini
Postdoctoral Researcher
Multimedia artist and researcher active in the fields of music, theatre, performance and installation art. Andrea completed a PhD at the Sonic Arts Research Centre in Belfast in 2012 with a study on musical interaction and spatialisation with live-electronics in the work of Venetian composer Luigi Nono. Since 2007 he has been working on audio, multimedia and interactive projects combining artistic and academic research with a focus on the integration of technology and the digital into the processes of art creation and fruition. His current work as a research fellow at Ca’ Foscari University focuses on performing arts ecosystems and cultural mapping. He collaborates as tutor and lecturer in sound design, digital design, media studies and research methodology with Nuova Accademia di Belle Arti (NABA), Istituto Europeo di Design (IED), H-FARM International School and SAE Institute.